


It’s impossible to separate maps from real estate analysis.
Maps provide buyers, investors, and analysts with information on neighborhood zoning, land boundaries, building footprints, and nearby amenities.
When I conduct real estate analysis, I use eleven maps. When using SRX Analyzer, I can switch between nine of these maps and maintain the same building as the anchor or focal point for my analysis.
The eleven maps I use are SRX Heat Maps, SRX Hotspots, Google, One Map, Land Lot, URA Master Plan 2014, URA Parks and Waterbodies, URA Landed Housing Areas, URA Building Height, URA Activity Generating Uses, and URA Street Block.
Here are my favorite maps and how I use them.
My first stop for any type of property analysis is SRX Heat Map, as it gives me a high-level understanding of real-time prices and transaction volume for each district or HDB town.
You can find this free resource at SRX.com.sg/heat-map. Here, for example, I find that District 1 is the most expensive region in Singapore with a real-time, median price-per-square foot (PSF) of $2,266 for private apartments.
Also, I see that the most expensive PSF for landed homes is found in Districts 11 and 12.
Finally, I learn that, in the last 90 days, the HDB towns of Tampines, Seng Kang, and Jurong West have seen the most transaction activity.
SRX Hotspots
My second stop is the SRX Hotspots maps. This weekly resource is new and is published at SRX.com.sg/research and at Straits Times Classifieds.
Here, I can locate the best property deals in Singapore for private and HDB sales and rentals. These four maps and their accompanying tables list properties that are asking for prices or rents below their X-Value.
One Map
While many of the analytic tools I use employ Google Maps as a resource, I prefer One Map Singapore. I find One Map easy on the eyes. It gives me a good feel for the neighborhood, its nearby amenities, and the basic shapes of the buildings. Also, SRX Property has transposed the cadastral land boundaries from the Singapore Land Authority (SLA) onto One Map. It is very cool to see the exact dimensions and shapes of a particular development.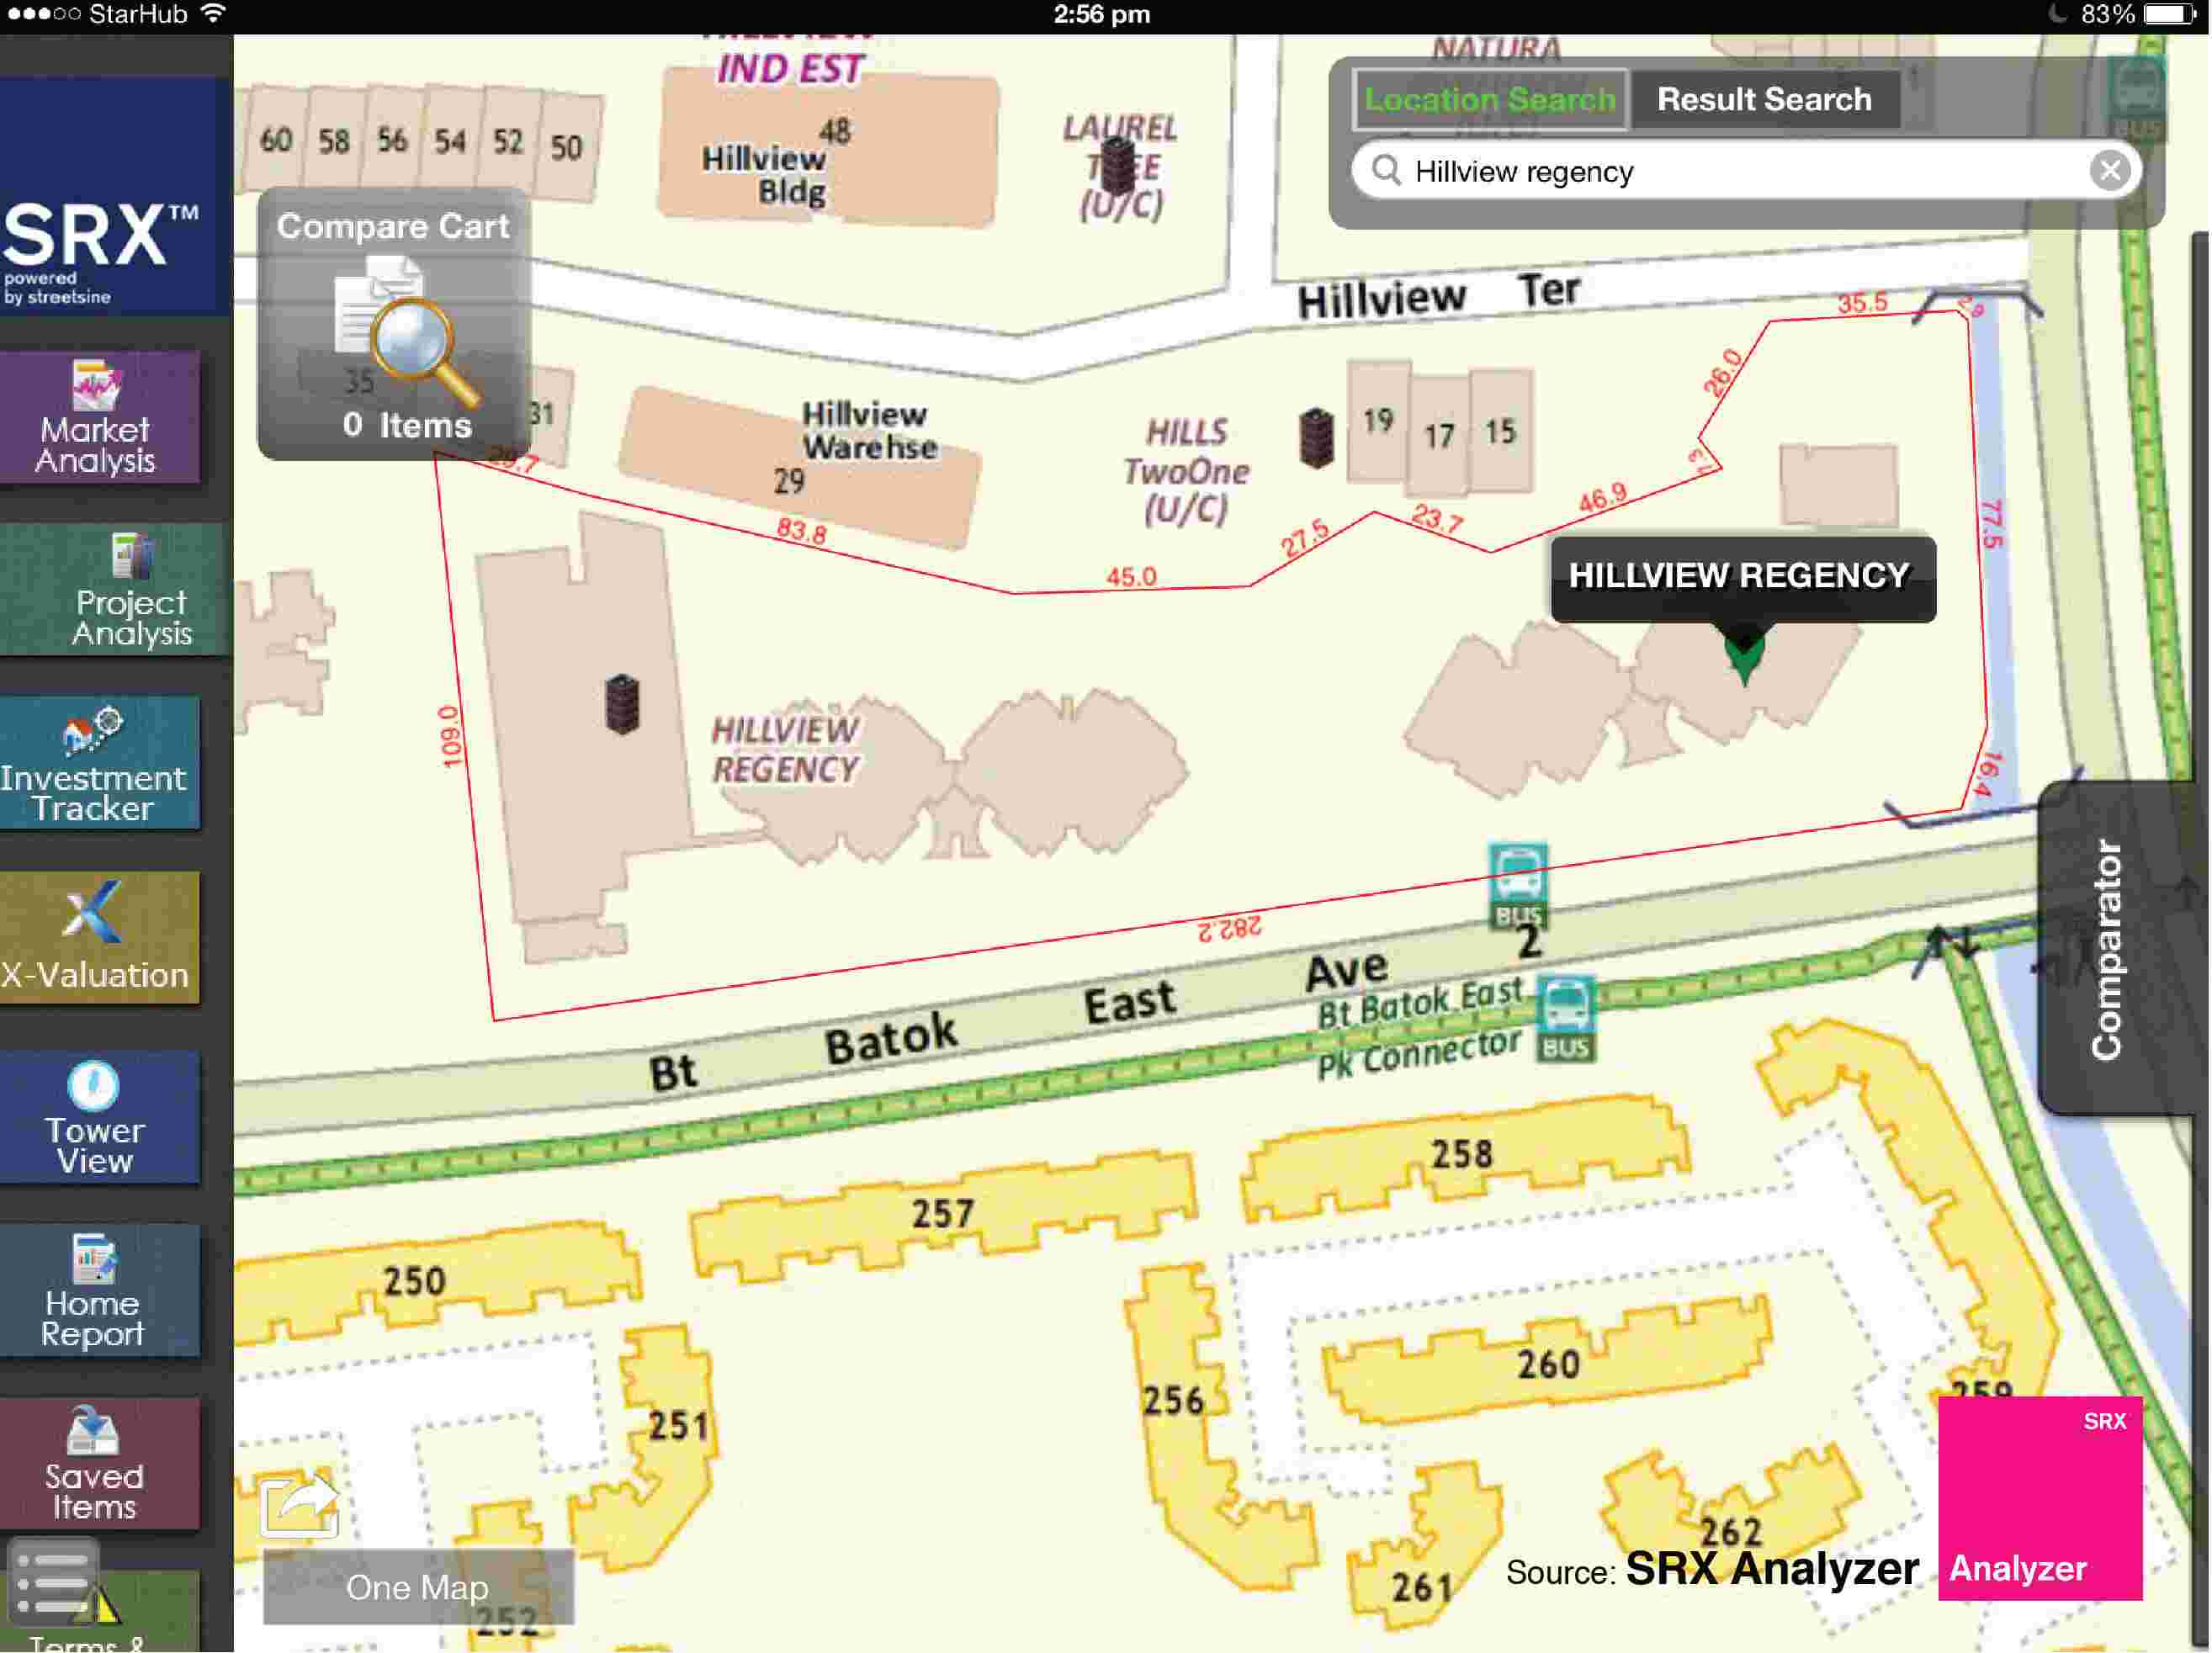
Land Lot
This SLA map gives the designation and shape for each land parcel in Singapore. Again, SRX Property has transposed the cadastral land boundaries on the Land Lot map and allowed me to switch effortlessly between it, One Map, and other maps. 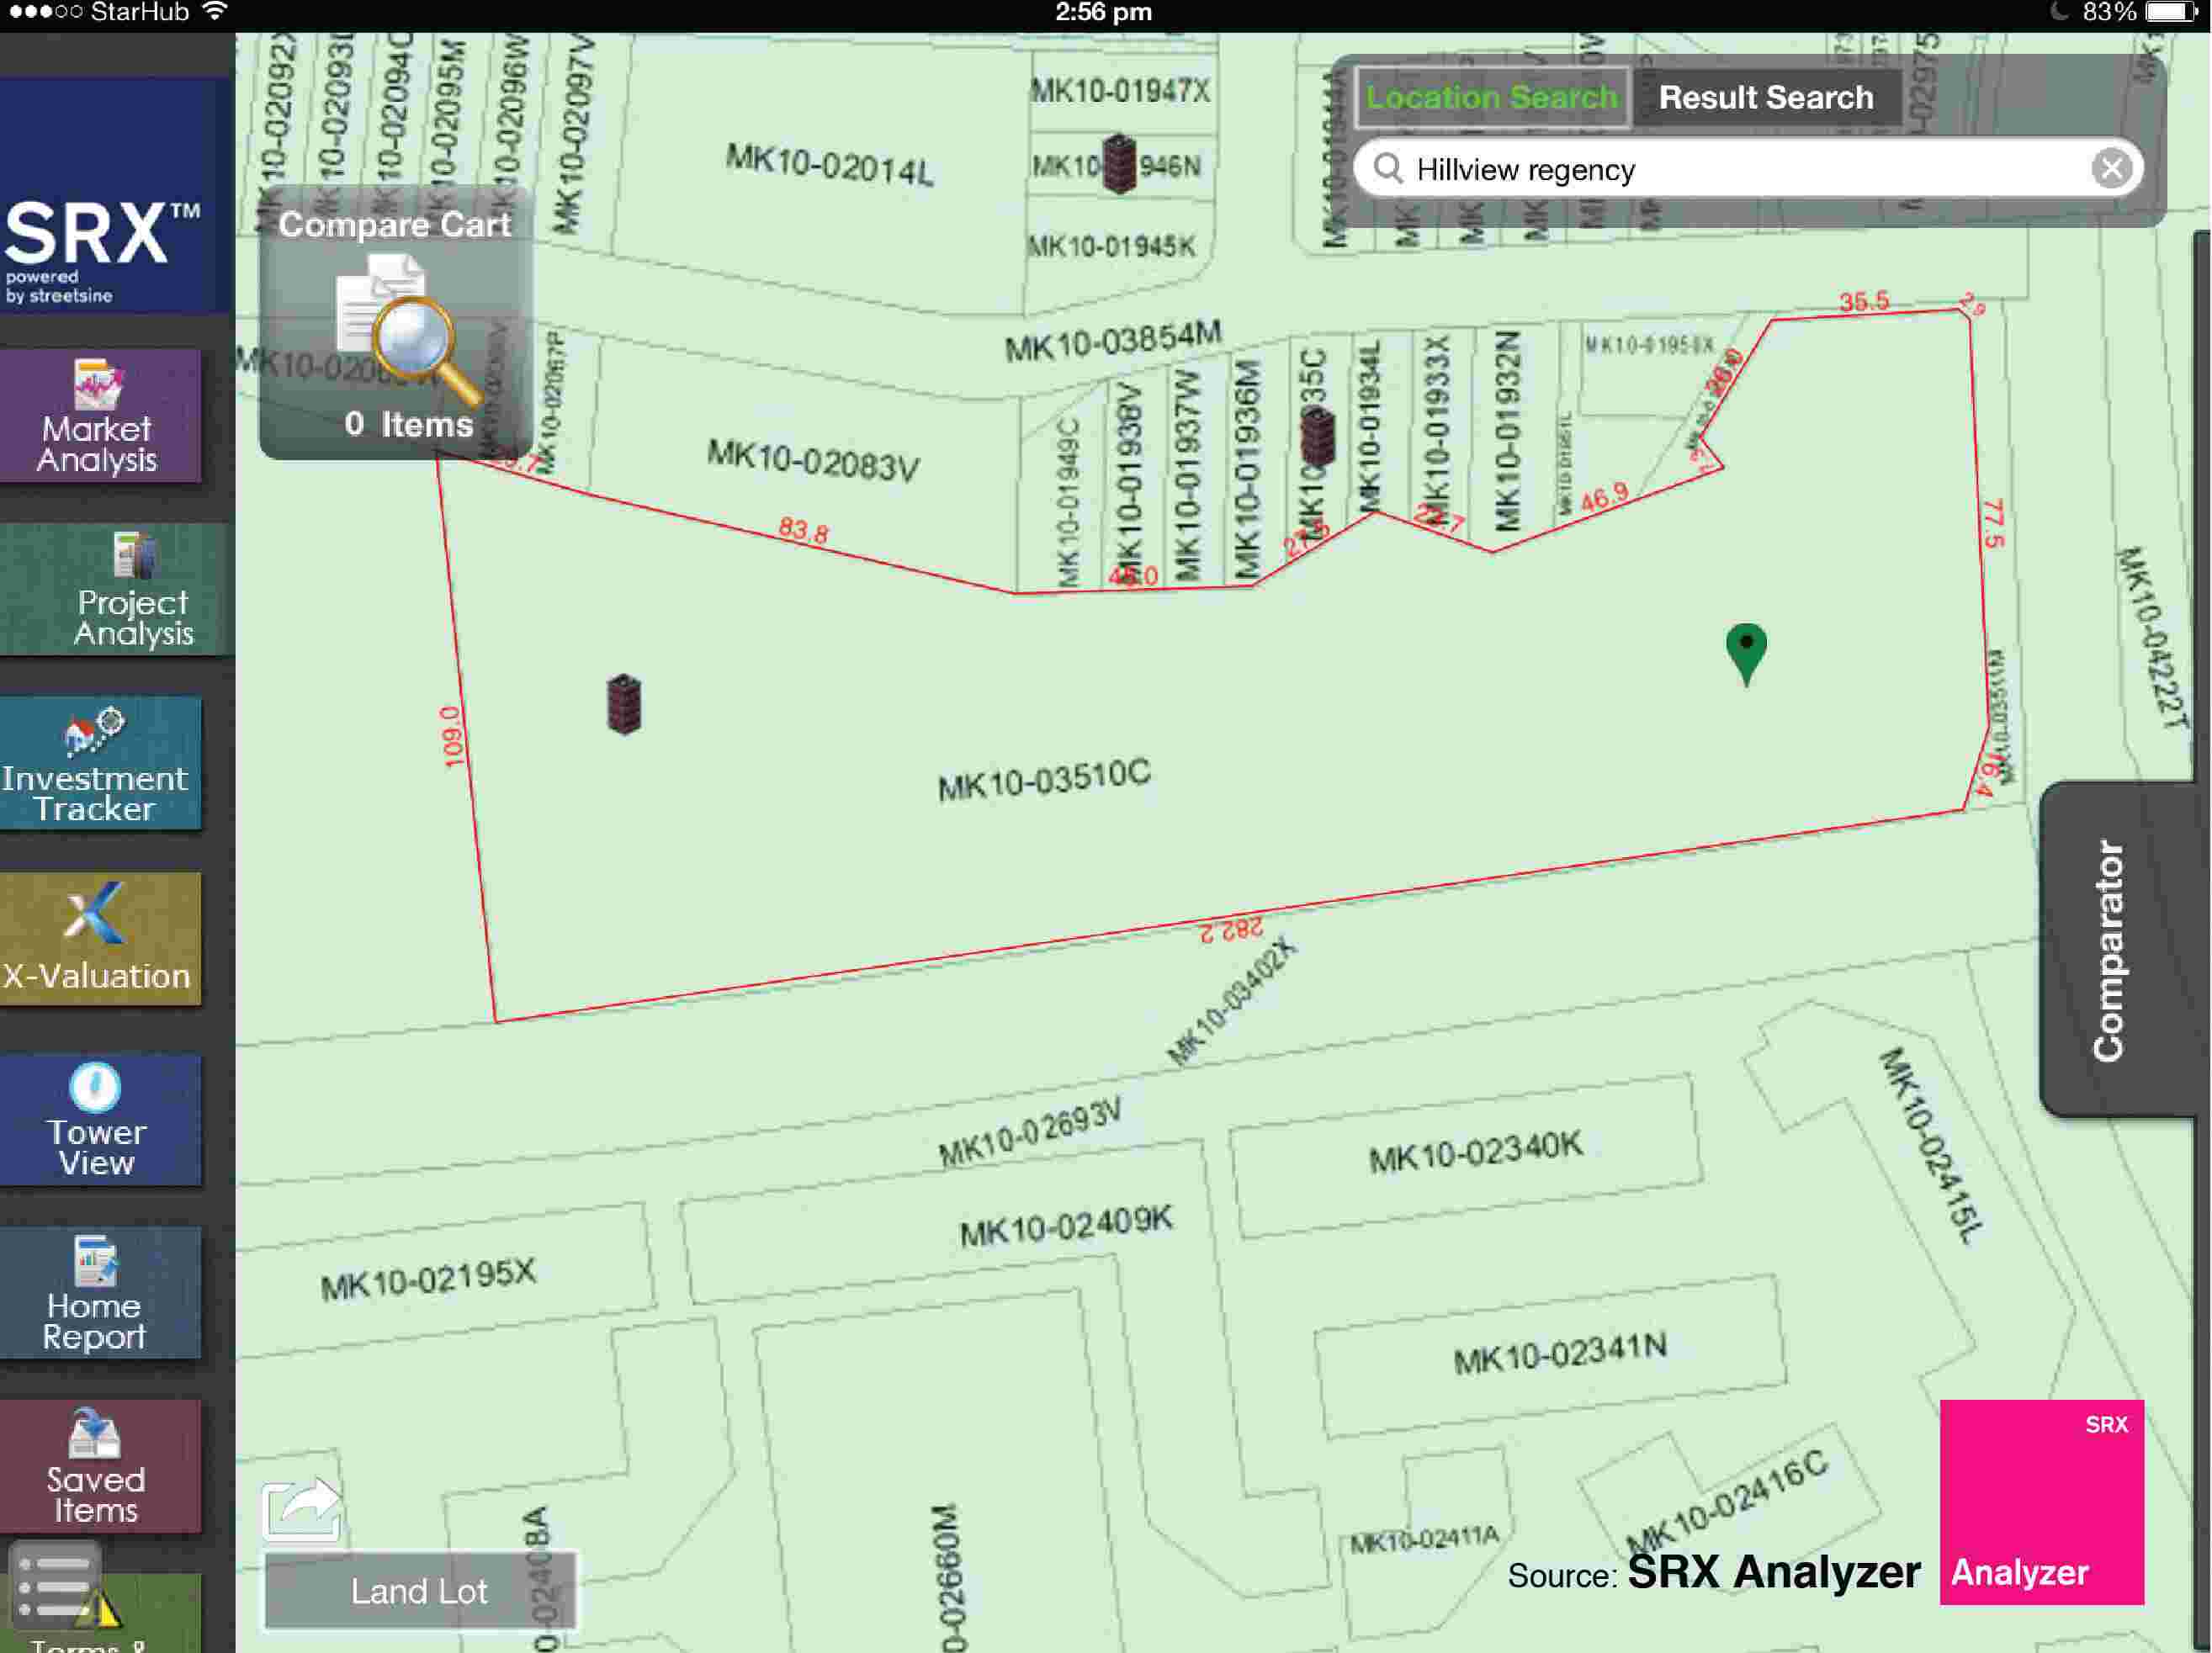
URA Parks and Waterbodies
As a person who enjoys the outdoors, gardens, and parks, this map tells me what type of greenery I can expect to see near the properties that I am studying. As I am of the opinion that parks increase the property value of nearby homes, accounting for greenery is key to my analysis.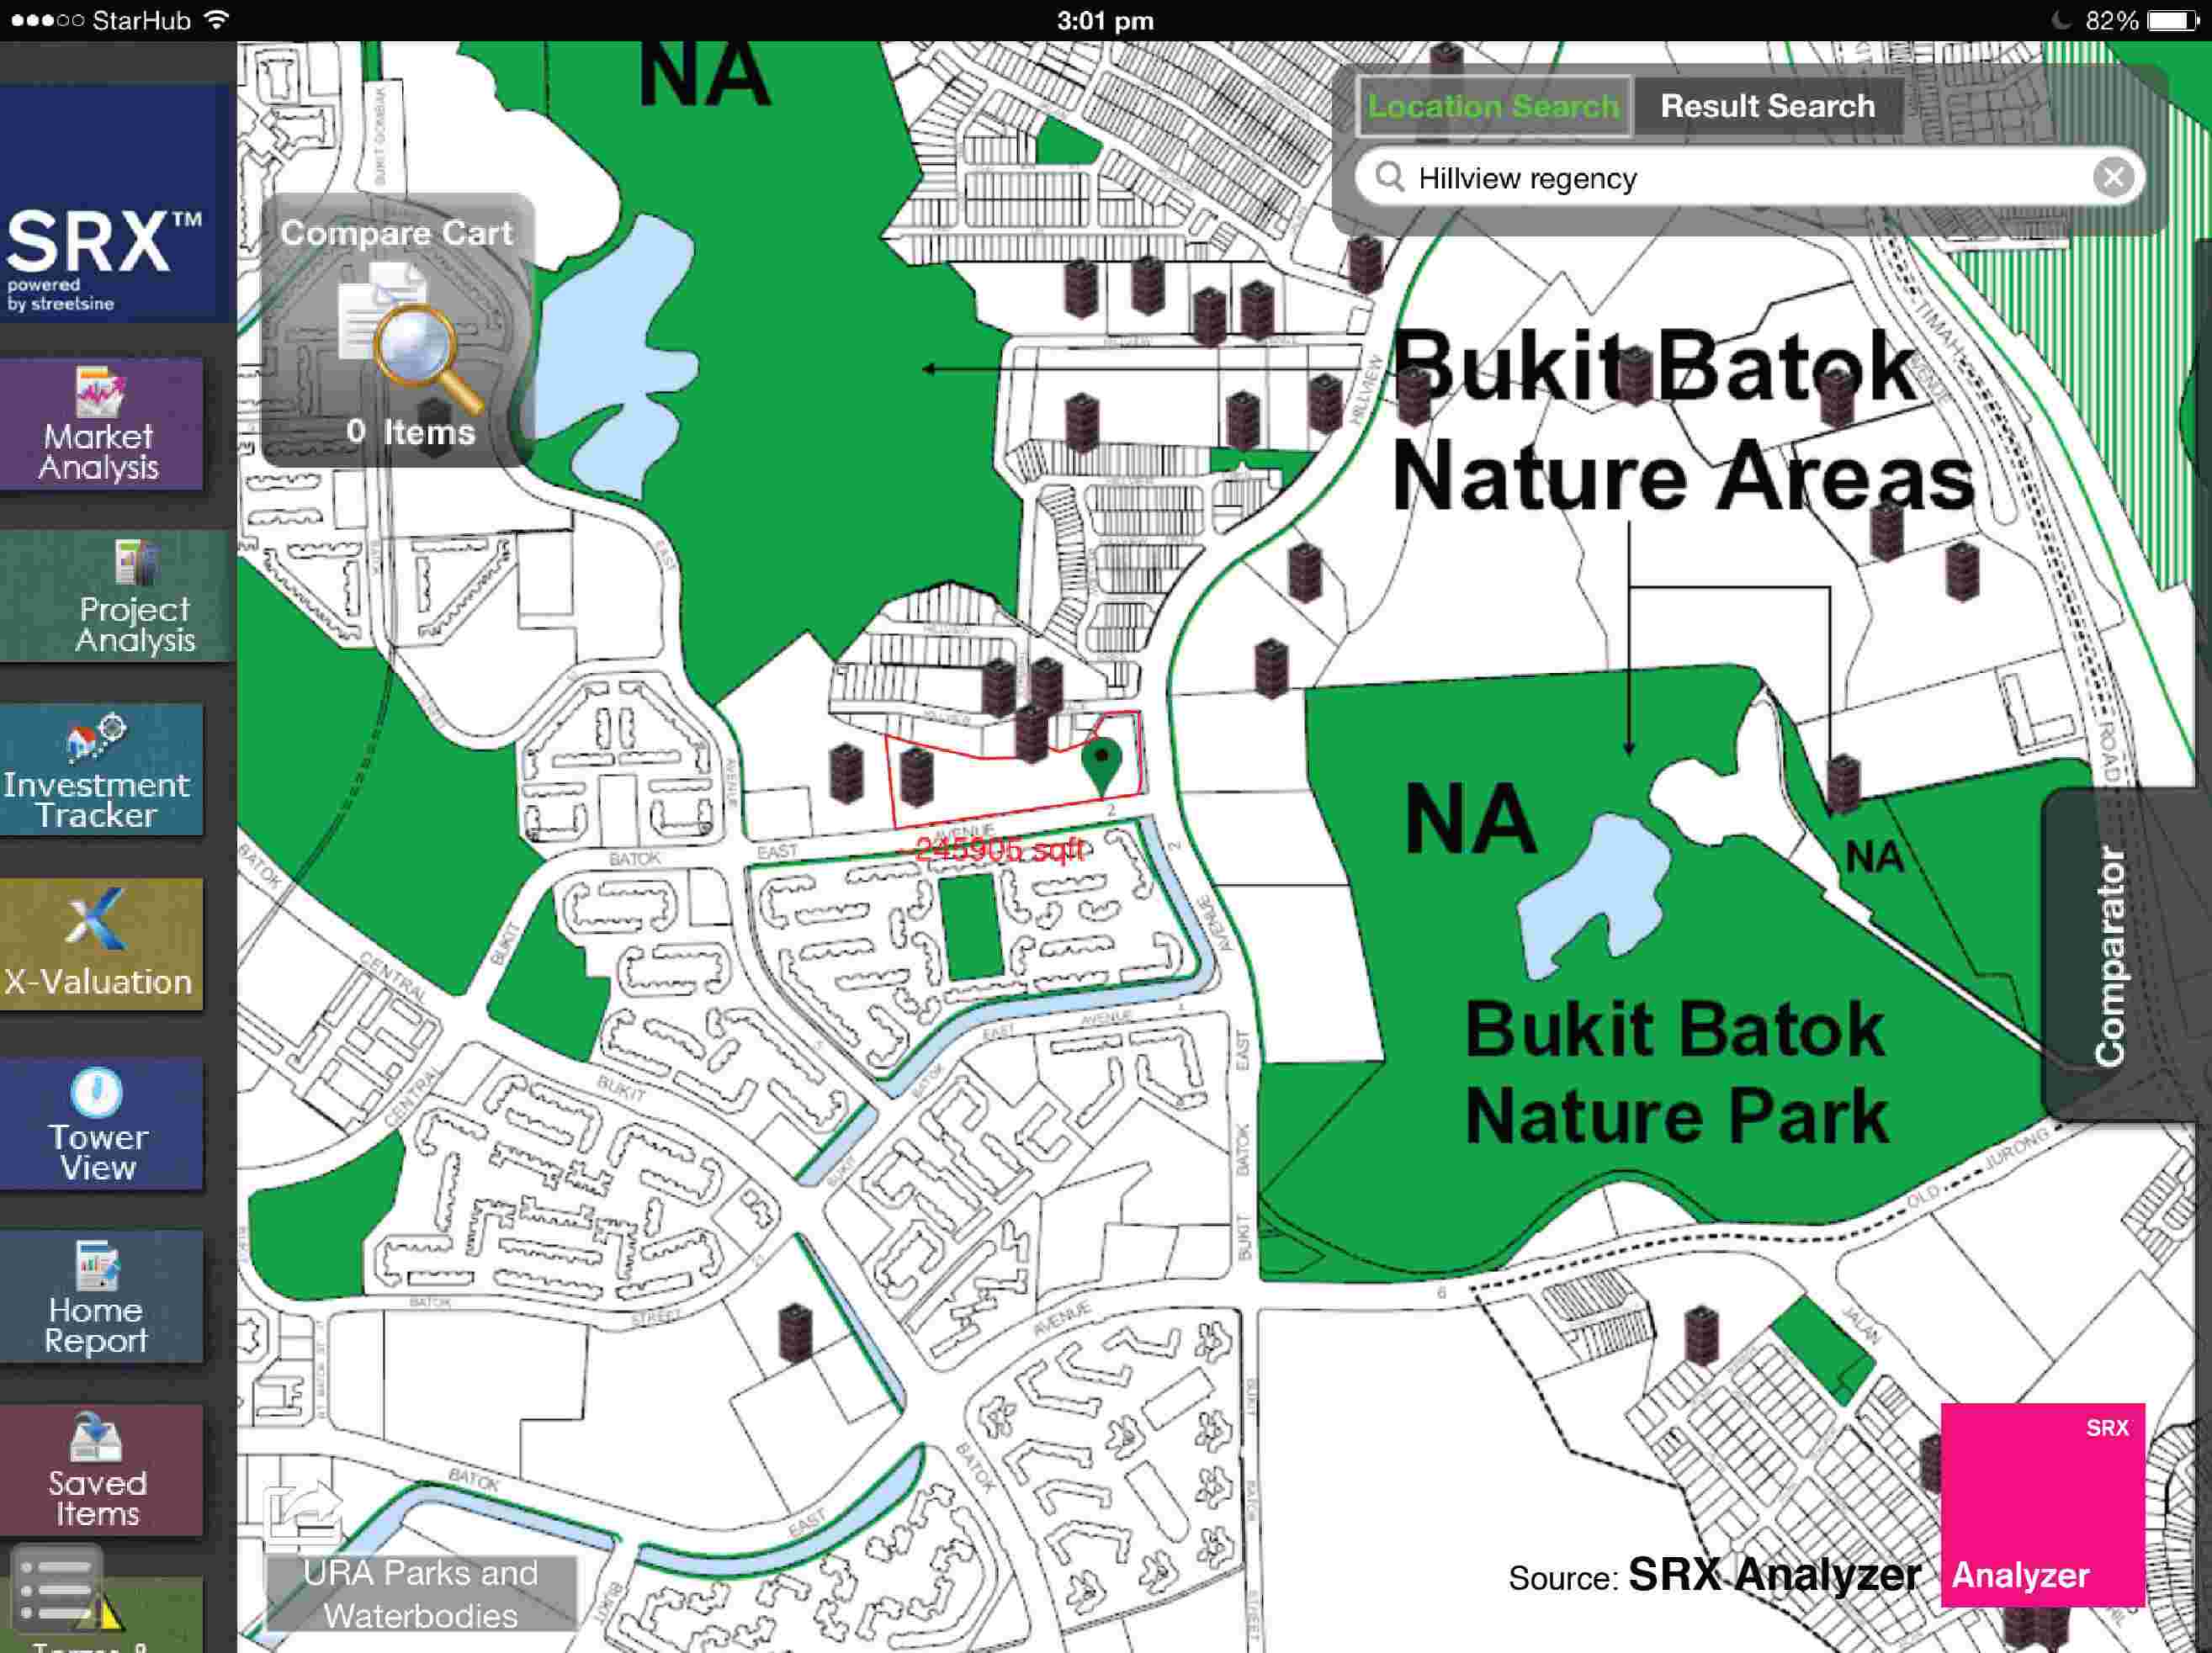
Thanks to maps, it’s much easier to conduct a deep analysis of property. Using the maps in an application like SRX Analyzer, I can construct a thorough understanding of all aspects of a property, from its price to its land configuration. These different maps give me insight beyond what I can see with the naked eye when I physically visit the properties.